Flow — the MobilitiLab platform

A unified platform for regional transportation analytics.

Flow brings together data from across the transportation system — planning, operations, safety, assets, and transit — into one place, built from the ground up for AI-first analysis.

In development · first deployments with regional agencies

flow · sacramento · map
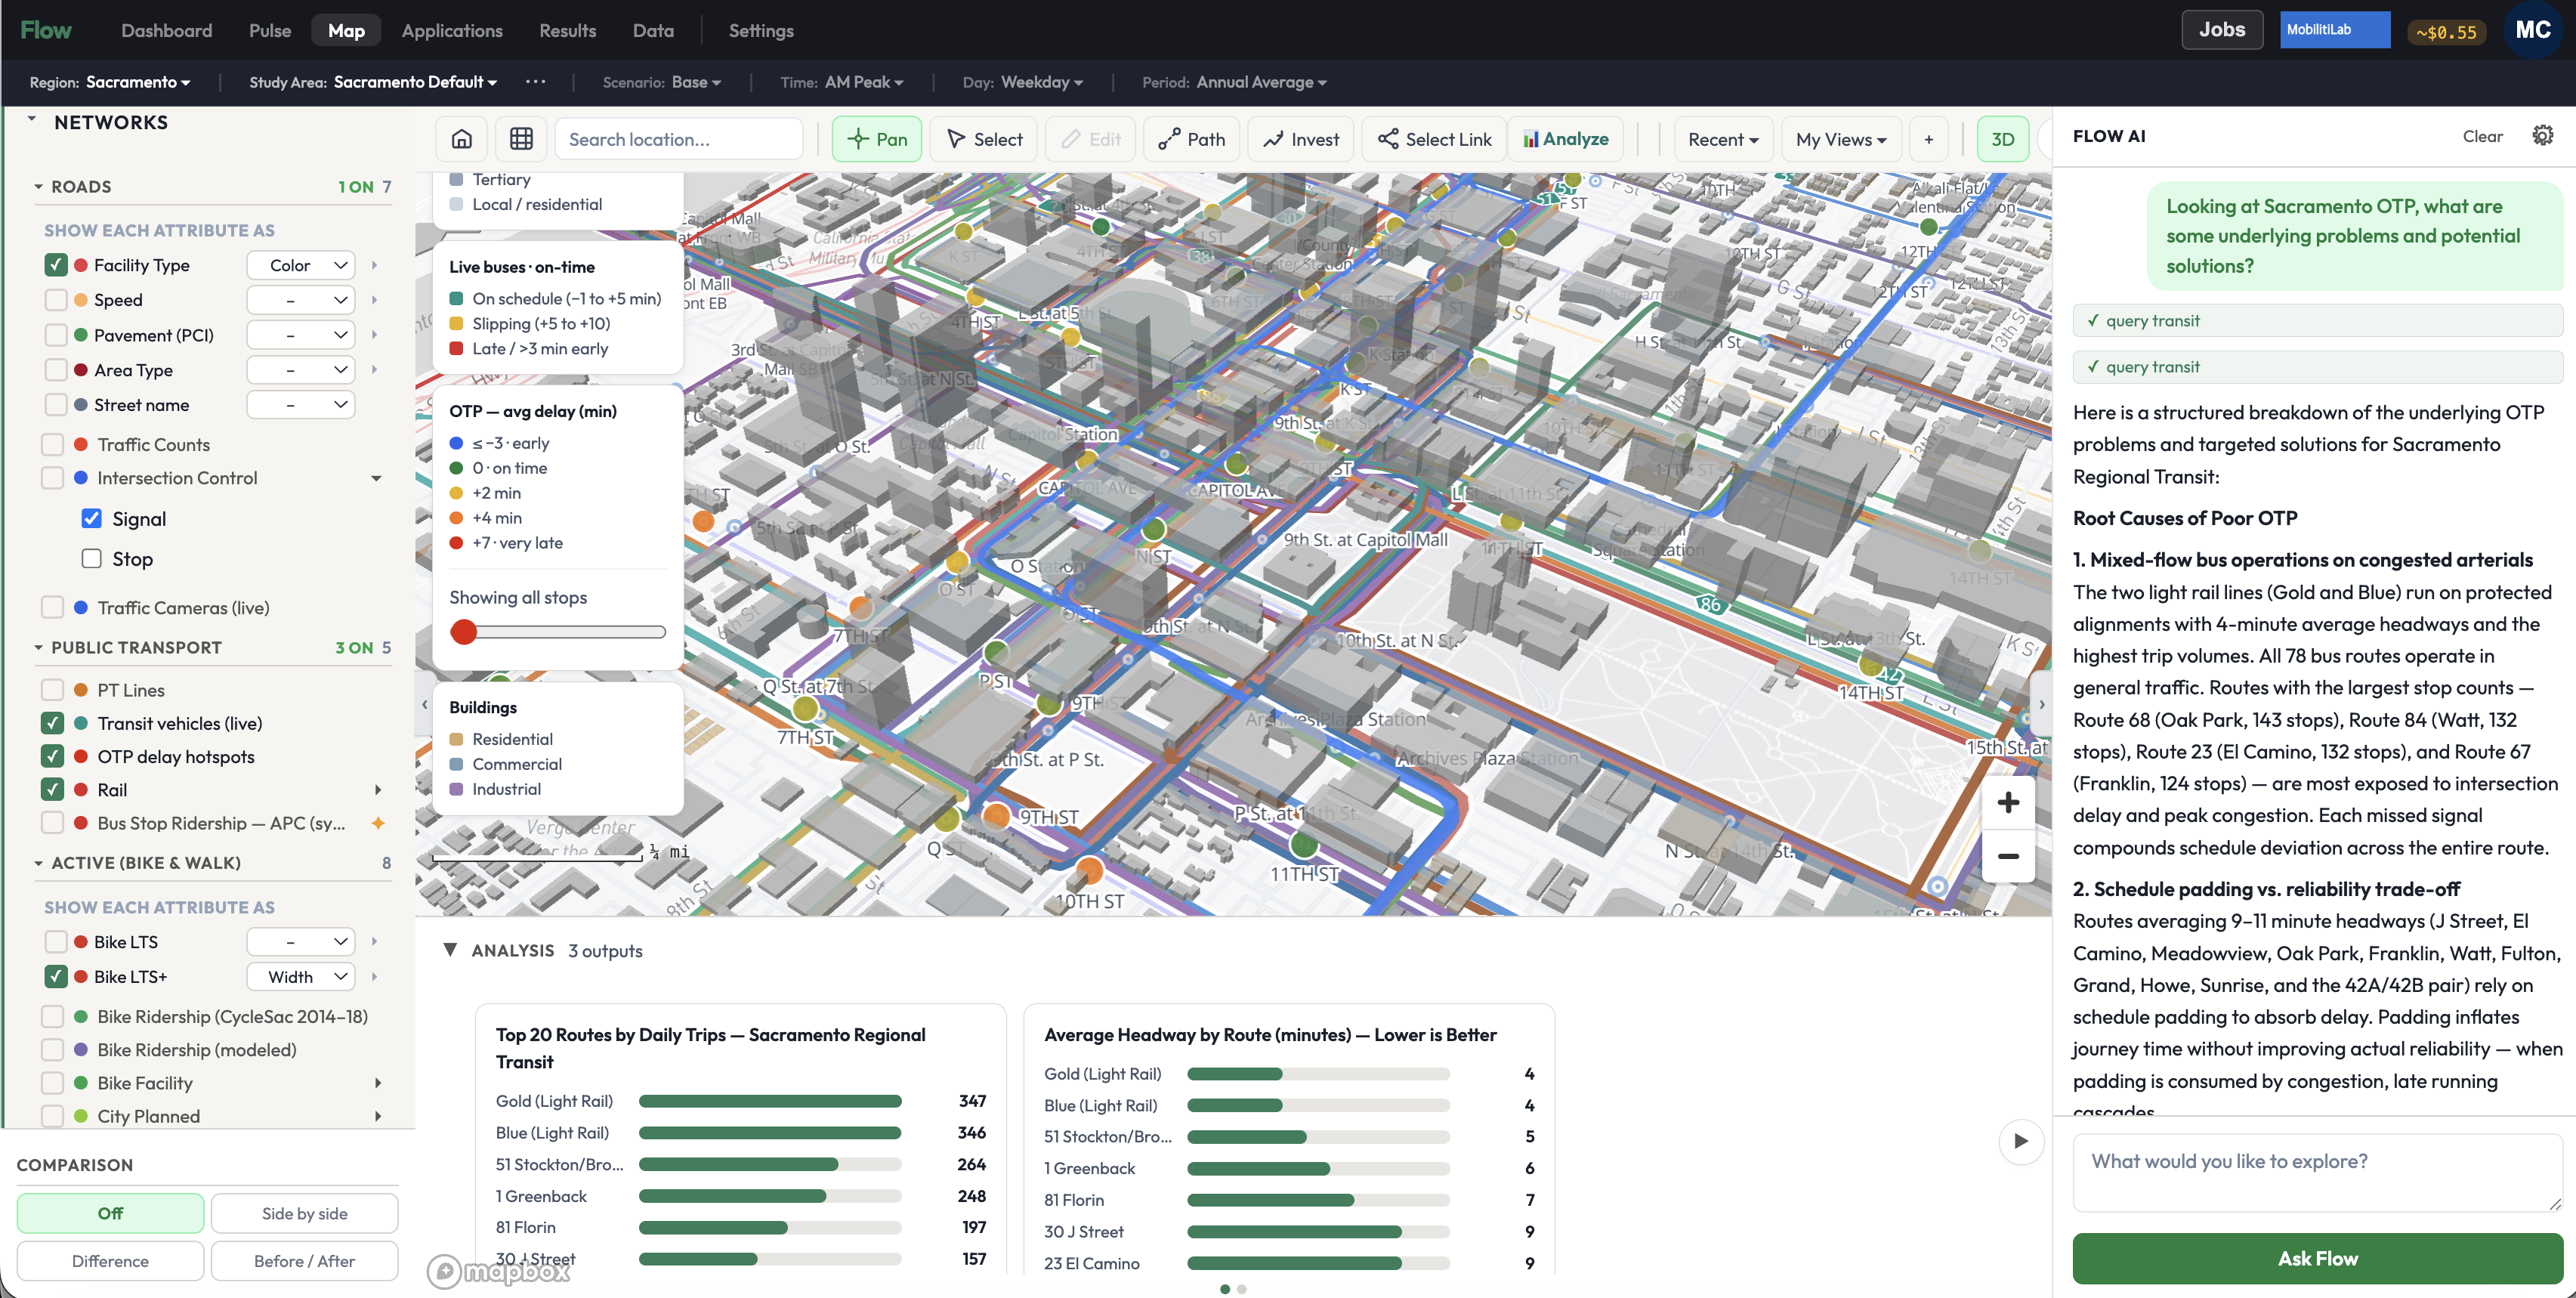
Flow's 3D map of Sacramento with layered road, transit, and rail networks, live buses, and an AI panel analyzing on-time-performance root causes.
Every mode
Road · transit · rail · bike · walk
One region
A single spine, from OSM to demand
AI-first
Analysis composed, never fabricated
Self-service
Onboard a new region, end to end

The problem

Transportation data lives in silos. Decisions have to cross them.

Planning, operations, safety, transit, and asset management each grew up with their own tools and teams. A regional question has to reach across all of them. Flow is the layer that brings them together — so the whole system can be analyzed as one.

What Flow noticed

An analyst that reads the whole region

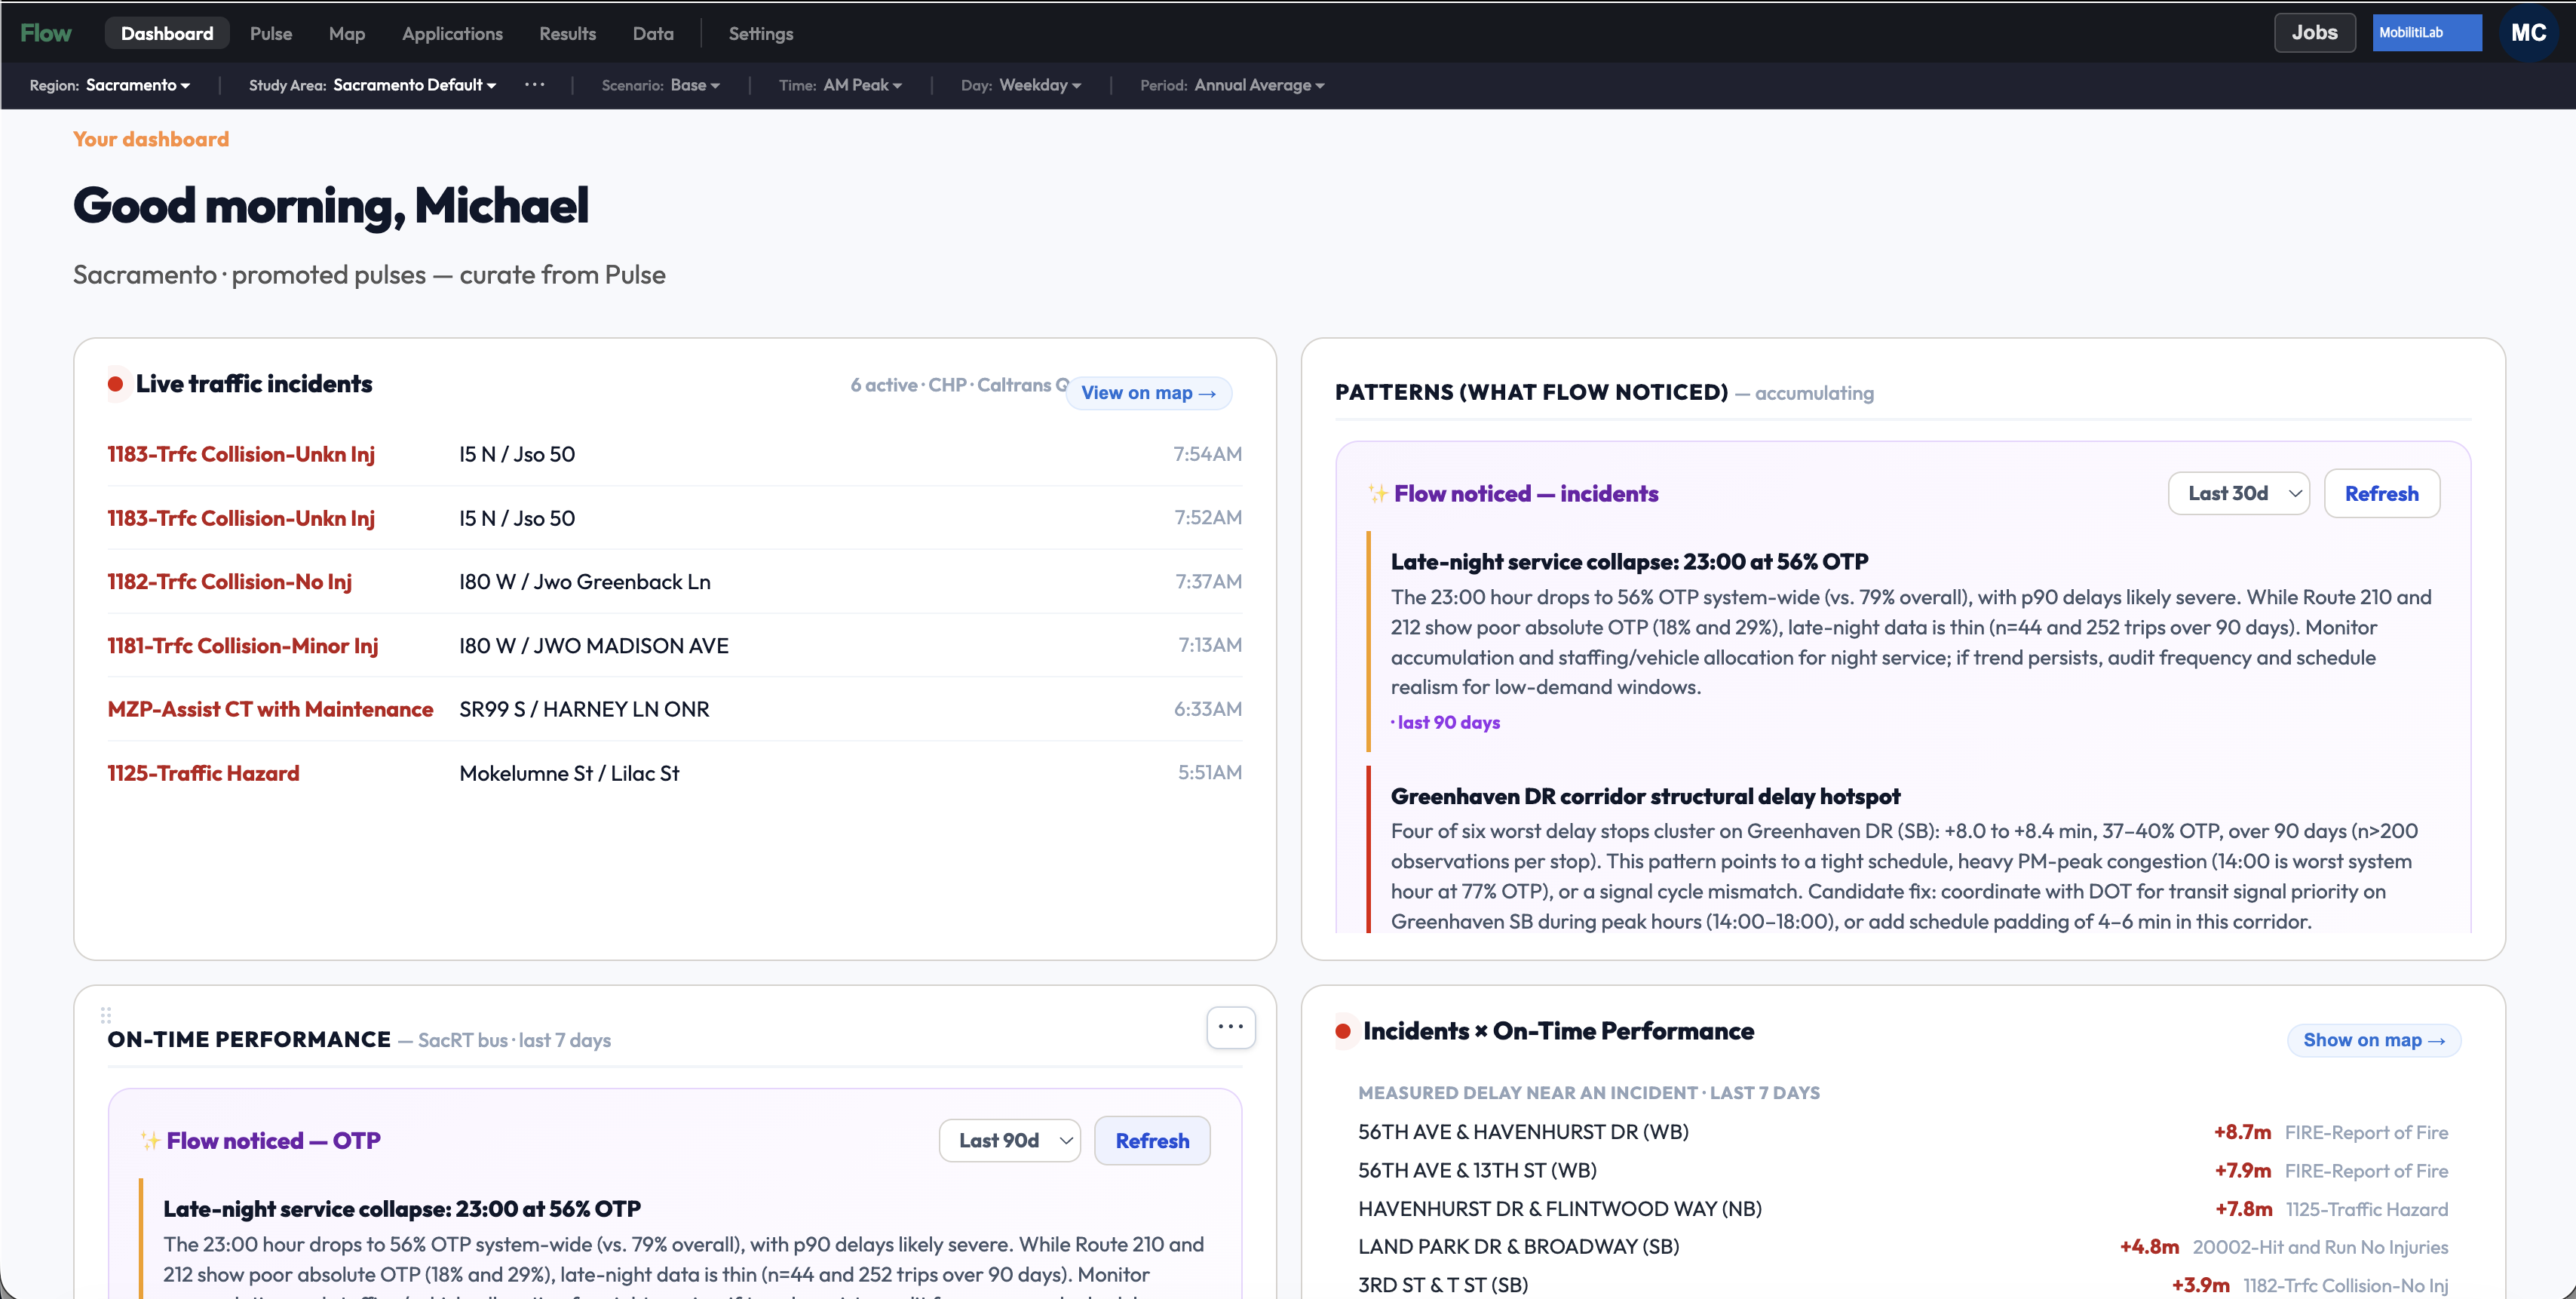
Flow watches the data and surfaces what matters — a late-night service collapse, a corridor where delay clusters, an incident pattern worth reviewing — in plain language, with the numbers behind it.

  • Live incident, transit, and performance feeds in one view
  • Patterns explained, with the evidence attached
  • Findings you can send straight to the map
flow · dashboard
Flow's dashboard with live traffic incidents and AI-generated pattern findings.
Unified operations

Every mode, on one canvas

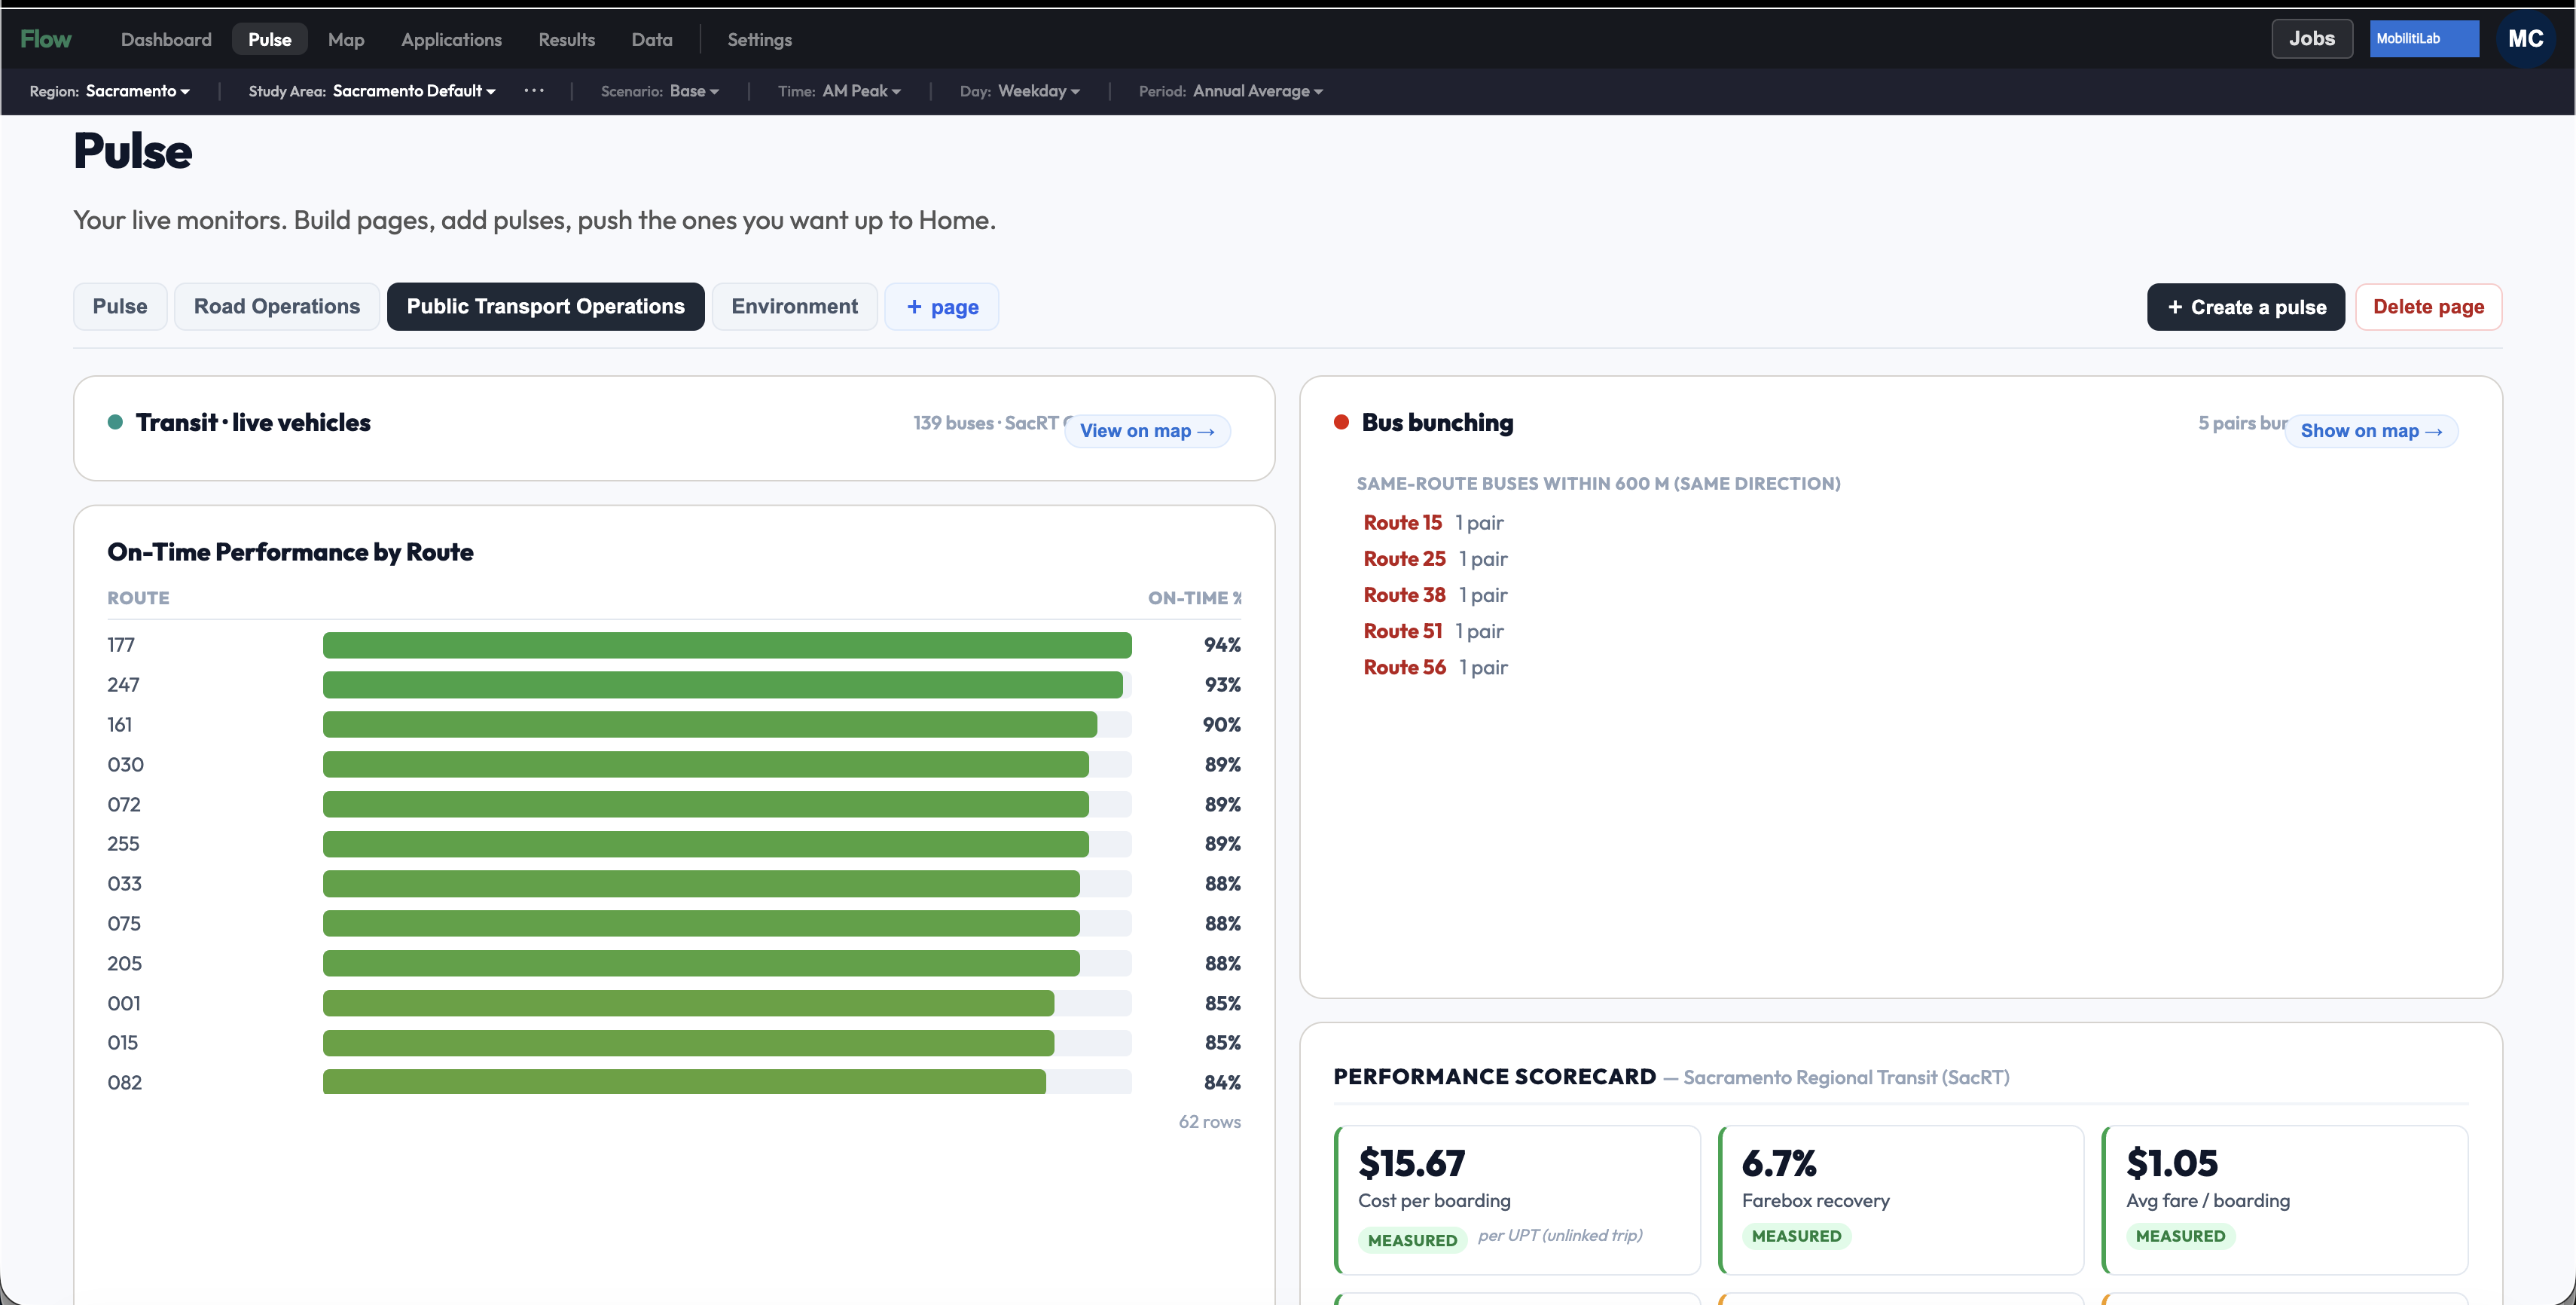
Live vehicles, on-time performance by route, bus bunching, and a cost-and-farebox scorecard — the operational picture that usually spans a dozen tools, built as monitors you compose yourself.

  • Road and public-transport operations side by side
  • Measured metrics, labeled as measured
  • Build a page, add a monitor, promote what matters
flow · pulse
Flow's Pulse page with live transit vehicles, on-time performance, bus bunching, and a performance scorecard.
Multimodal analysis

Ask a real question, get a grounded answer

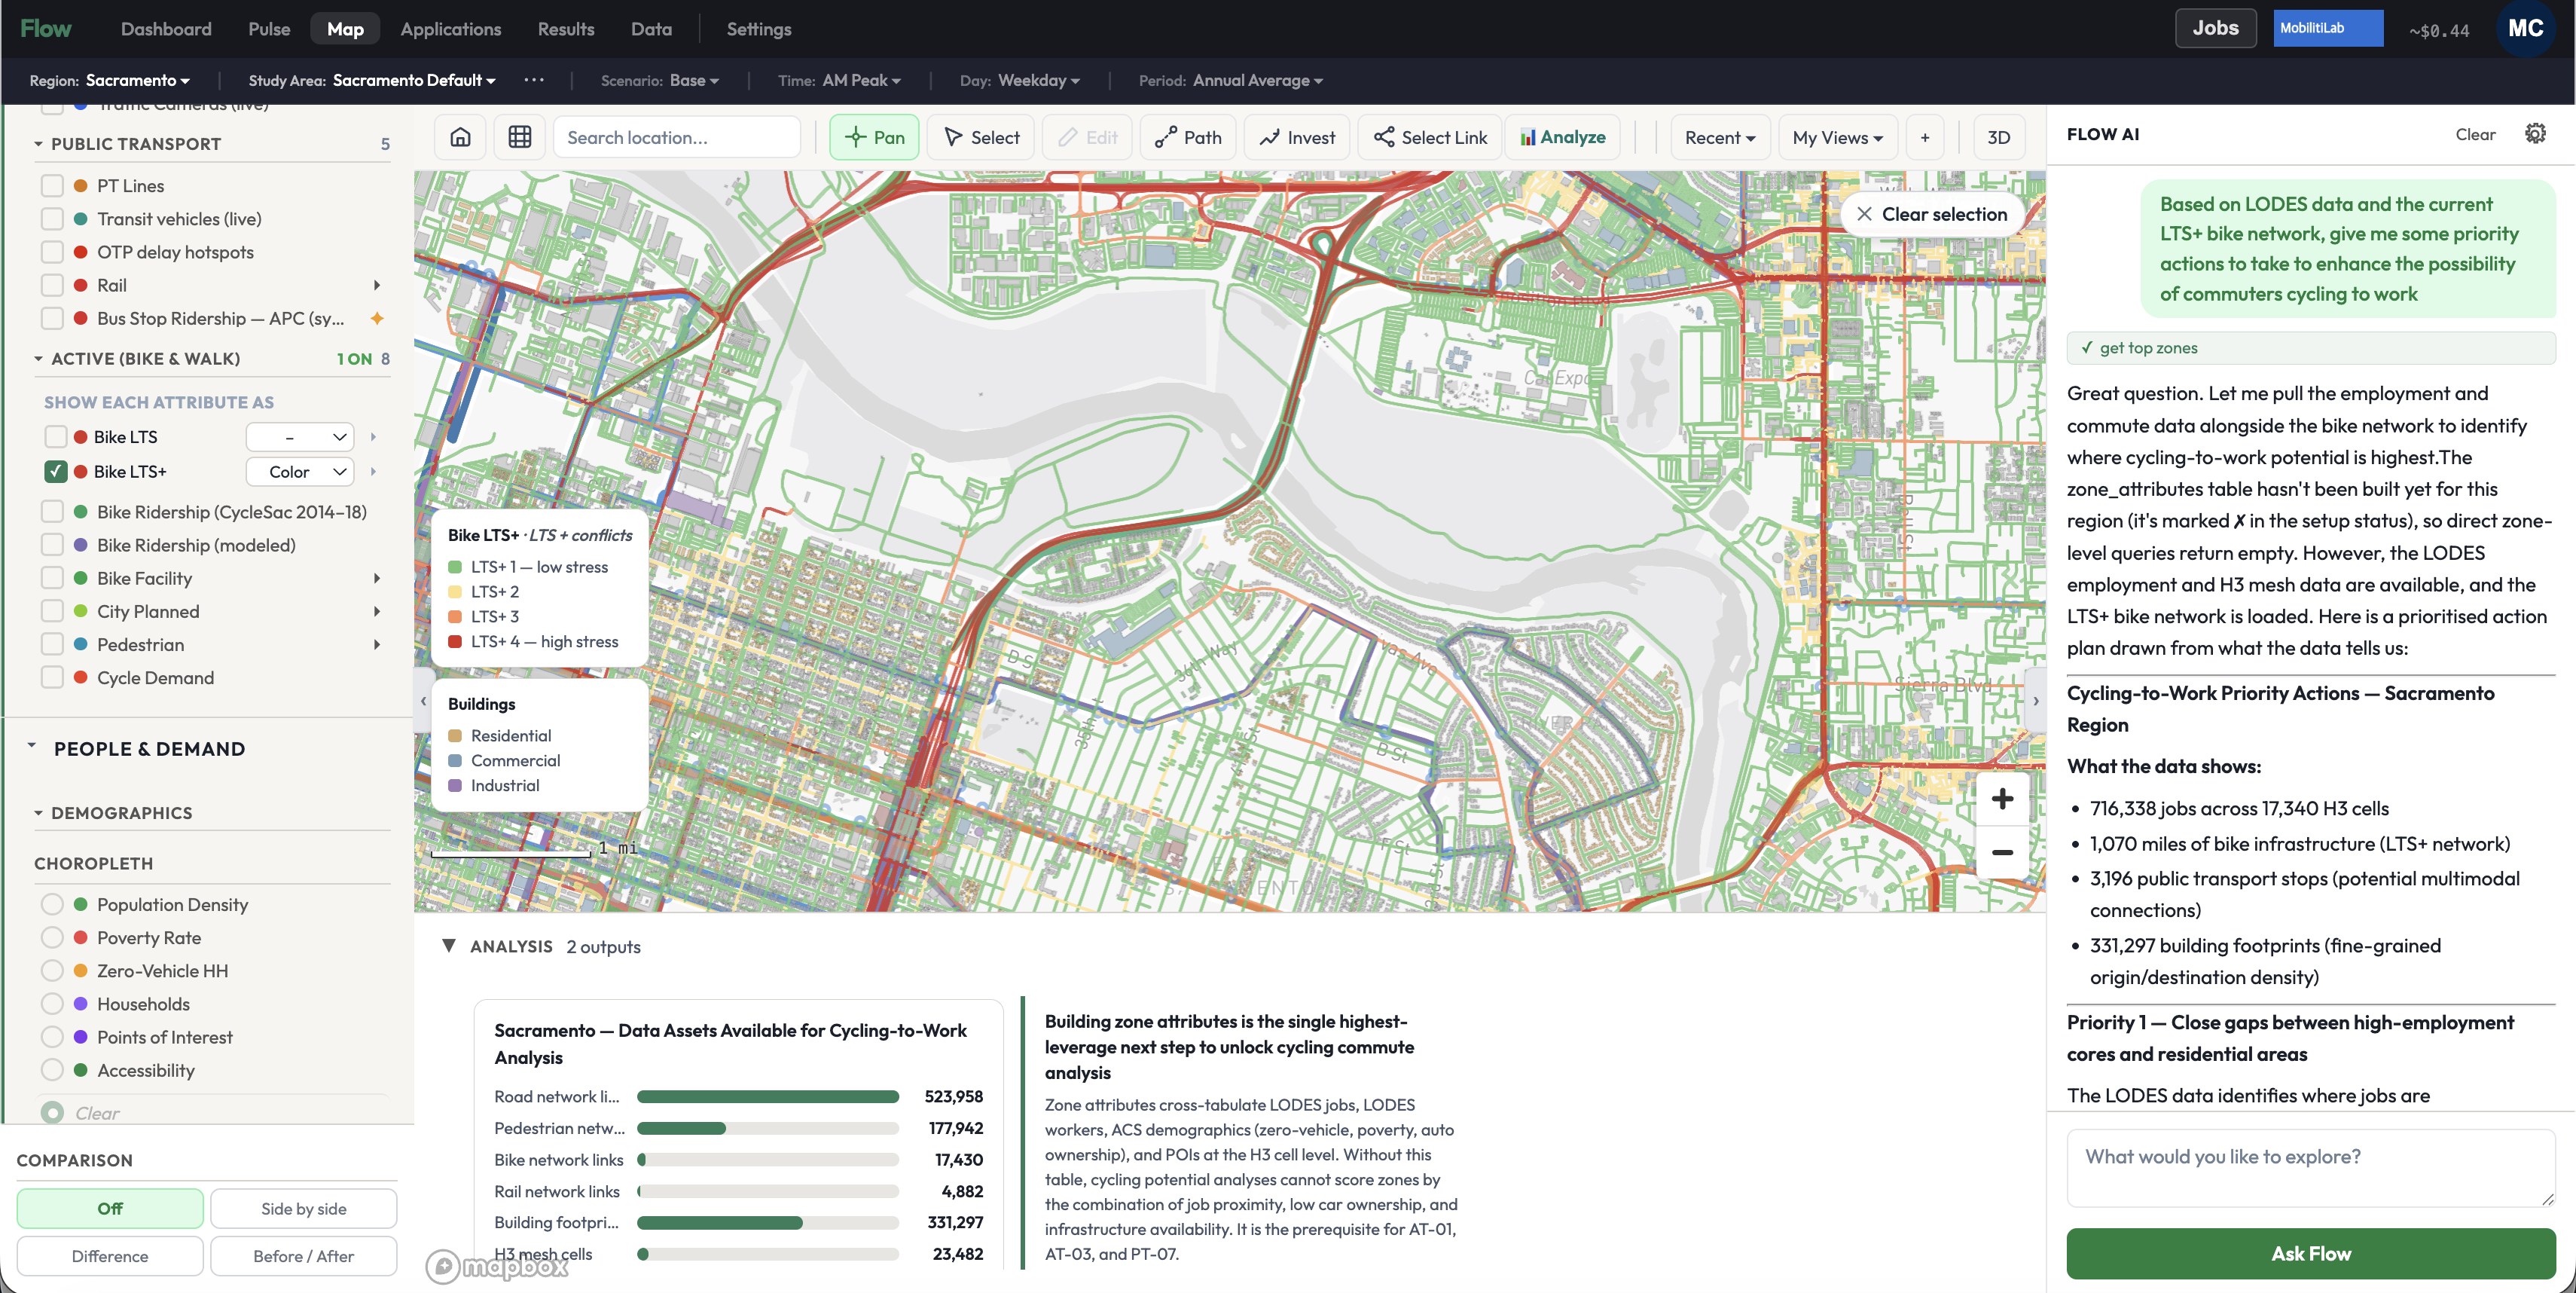
Combine employment, demographics, and the bike network to find where cycling-to-work potential is highest — and when a dataset isn't there yet, Flow tells you, and works with what is. Analysis is composed from verified data, never invented.

  • Land use, demand, and network in one model
  • Bike stress, accessibility, and ridership layers
  • Honest about what the data can and can't answer
flow · bike network
Flow's bike-network level-of-traffic-stress view with an AI-generated cycling-to-work priority action plan.

The platform

One spine, three editions.

Flow is built on a single regional model — one network, one zone system, one set of demand data — so planning, forecasting, and public reporting all speak the same language.

01

Flow Planner

The analyst's environment — networks, scenarios, assignment, accessibility, editing, and comparison.

02

Flow Forecast

Travel forecasting you can inspect and trust — not a black box.

03

Flow Public

The regional transportation picture, made legible for the public it serves.

Built differently

The AI composes verified artifacts. It never generates the data.

Every figure Flow reports traces back to a real record. When the AI writes a narrative, names a location, or builds a report, a deterministic layer binds it to the underlying data — so the analysis is fast and conversational without ever drifting into invention.

A regional model on an H3 spine.
Networks derived from the region's own data.
Self-service onboarding, end to end.
Git-style version control for scenarios.
No hardcoded assumptions about any one place.

About

Built by someone who built the last one.

Flow is being built by someone who has already built the platform the field relies on — the creator of CUBE, the travel-demand modeling software that became the standard for MPOs and DOTs for a generation, grown through Citilabs to its acquisition by Bentley Systems, and later president of Teralytics, bringing large-scale mobility data into transit analysis.

That history is the point. The last dominant platform in this field was designed before the cloud, before modern data pipelines, before AI could read a region's data and reason about it. Flow is the attempt to build what comes next — with the benefit of having built the previous generation and knowing exactly where it fell short.

MobilitiLab is deliberately small and deliberately careful. Every layer of Flow is verified against a case a planner can check by hand before it ships, no place is hardcoded into the model, and the AI is held to a hard rule: it composes analysis from verified data, and it never invents.
Early access

See what a unified regional platform looks like.

Flow is in active development, with first deployments underway. If you work at an MPO, a transit agency, a DOT, or consult for them, we'd like to show you.

Or email michael@mobilitilab.com